
WGN, the Journal of the IMO 30:3, 2002, pp. 47-55
Shigeo Uchiyama
Many Japanese observers observed the Leonid meteor storm of 18/19 November 2001. It is thought that the storm was caused by the 4-revlution (1866) and 9-revlution (1699) dust trails of comet 55P/Tempel-Tuttle. Since the Earth encountered these trails at almost the same time, it is difficult to separate activities of these trails from the ZHR profile. However, the population indices of these trails are not the same. By estimating the population indices of these trails, the individual ZHR profiles of these trails can be estimated.
It was predicted that 4-revlution (1866) and 9-revlution (1699) dust trails would cause a Leonid meteor storm on November 18-19, 2001, and that the storm would be favorably seen in eastern Asia and Australia [1,2,3]. Many observers recorded the Leonid storm and ZHR profiles were determined [4,5]. I derived ZHR profile, too (next section). It is important to determine the activities of individual trails for the study of dust trails and the prediction of 2002 Leonids. But the predicted peak times of the 4-rev and 9-rev trails were close and their meteors appeared at the same time, therefore it is almost impossible to separate the activities of individual trails from the ZHR profile.
It is expected that the population index r of the 9-rev trail is smaller than that of the 4-rev trail[3]. If their r-values are determined and if they did not change in the observing period, it is possible to estimate the activities of the individual trails from the magnitude data. Since their meteors appeared together, it is difficult to determine the r-values of individual trails. But their predicted peak times were not exactly the same time. The peak time of the 1699 trail was earlier, thus it is possible to estimate the r-values of individual trails in some degree.
In this work, I analyzed magnitude data reported by the following 12 Japanese observers:
Takema HASHIMOTO (4.17h), Daiyu ITO (2.69h), Kenya KAWABATA (3.33h), Katsuhiko MAMETA (3.55h), Masayuki OKA (4.08h), Hiroyuki OKAYASU (3.5h), Kazuhiro OSADA (3.33h), Koetsu SATO (3.16h), Minoru SHIMIZU (4.47h), Masumi SHIMIZU (3.6h), Syoichi TANAKA (0.97h), Shigeo UCHIYAMA (4.33h).
Koetsu Sato and Masumi Shimizu observed at Shenyang, China, and the others observed in Japan. I used the data with radiant elevation above 15°. I did not apply topocentric time correction as described in [6], because the corrections did not exceed 1 minute in Japan, and did not exceed 2 minute at Shenyang.
In the previous paper [5], I got ZHRs per magnitude class. Here, I derived the ZHR by summing up ZHRs per magnitude class binned in 5-minute intervals. The result is available in Figure 1. The peak time is 18h17m ± 3m UT, which corresponds to a solar longitude 236°.459 ± 0°.002 (J2000.0), and the peak ZHR is 3120 ± 100. The Peak ZHR that I derived is lower than the value in [5], and slightly lower than the value in [4]. I found a tendency that observers who did not record magnitudes counted larger number than observers who recorded magnitudes. That is possible when exceptionally many meteors appear. Therefore, that is why the ZHRs of this article are lower, I suppose. The ascending branch from half maximum to peak rates took 51 ± 4 minutes and the descending branch to half maximum lasted 41 ± 4 minutes. Then the full width at half maximum (FWHM) is 92 ± 6 minutes. It is thought that the peak was caused by the 4-rev trail mainly and the 9-rev trail encountered the Earth earlier. The reason of the ascending branch being longer may be the contribution of the 9-rev trail. However, it is difficult to separate each trail activity from the ZHR profile.
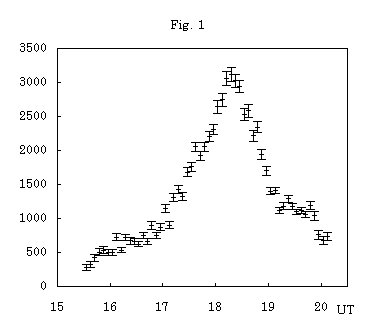
Figure 1
Observed ZHR profile derived from data of 12 observers. The ZHRs are derived by
summing up ZHRs per magnitude class binned in 5-minute intervals.
Observed meteor numbers are not true meteor numbers. We must calculate the true zenithal hourly rate per magnitude class, ZHRt,m, to analyze the magnitude data. I obtained ZHRt,m by the following formulae;

with

where Nm is the number of observed meteors in one magnitude class m, Teff is the effective observing time, F is a possible field obstruction factor, Pm is the perception provability for the magnitude class [7], and hR is the radiant elevation.
Figure 2 shows the relation between meteor magnitude and ZHRt,m for various periods. The logarithmic scale of the vertical axis makes the relation almost linear.
In the previous article [5], I got ZHRs per magnitude class, and it was shown that the activity of bright meteors (magnitude -2 and brighter) was nearly constant. It is indicated that the 4- and 9-rev trails included few bright meteors. But the total ZHR of at least magnitude -2 meteors was around 40 which was too high for the annual activity of the Leonids. Therefore, it is indicated that there was a source of bright meteors. That might be old diffused trails or a resonance region, although I cannot conclude on that.
Then, it is thought that the Leonid storm contained meteors from five sources, (1) the 4-rev trail, (2) the 9-rev trail, (3) the 10- and 11-rev trails [1,2,3], (4) the annual background, and (5) a source of bright meteors.
Since the ZHR value was already above 280 at the beginning time of the analysis and was over 700 near then end time, the influence of the annual background activity can be neglected. As we want to know the activities of individual trails, we have to reduce the influence of the source of bright meteors. If you look at Figure 2 carefully, you can see that the ZHRt,m of the magnitude range 0 - +4 fits well to a straight line, and the numbers of bright meteors are slightly larger than the values on the regression lines for the magnitude range 0 - +4. They indicate that there were meteors by a source of bright meteors, too.
Then, I used the meteors of the magnitude range 0 - +4. It is thought that the numbers of meteors from a source of bright meteors would be much fewer than from the dust trails in this range.
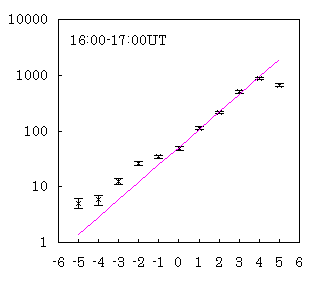
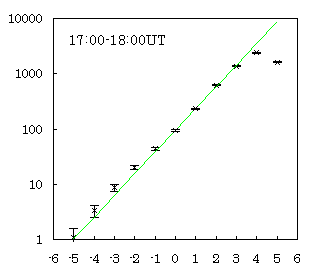
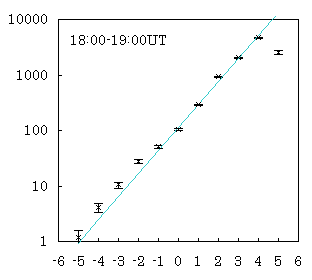
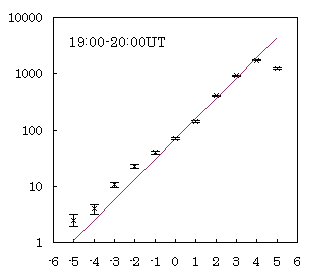
Figure 2 - Relation between meteor magnitude and ZHRt,m for various periods.
The horizontal axis is the meteor magnitude, and the vertical axis is the logarithmic scale of ZHRt,m.
While ZHRt,m of the magnitude range 0 - +4 are good fits to straight lines, ZHRt,m of bright meteors are slightly larger
than the values on the regression lines of the magnitude range 0 - +4.
Population indices for the magnitude range 0 - +4 are calculated by the regression method. On the left hand side of Figure 3 there is the result binned in 5-minute intervals and shows a large scatter. For the 2001 Leonids, storm level activity was expected, and too many meteors appeared actually, thus many observers counted meteor numbers and did not record magnitude data. Only 12 observers reported detailed magnitude data, and the amount of data is insufficient for a short-term resolution analysis such as 5-minute intervals. On the right hand side of Figure 3 there is the result binned in 30-minute intervals shifted by 15 minutes.
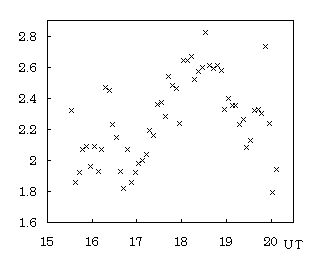
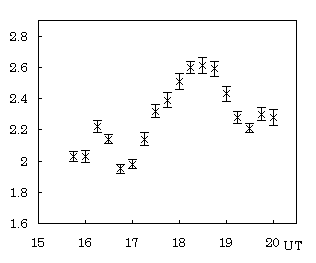
Figure 3 - Population index profile derived by the regression method applied to
the magnitude range 0 - +4.
Left: Binned in 5-minute intervals. Right: Binned in 30-minute intervals shifted by 15 minutes.
Figure 3 shows that the population index for the magnitude range 0 - +4 goes up with the rise of the ZHR, but the r-values after the ZHR peak time are larger than before. Thus, it is supposed that the population index of 4-rev trail r4 is larger than the population index of the 9-rev trail r9. The peak value of population index for the magnitude range 0 - +4 is 2.61 ± 0.05 at 18h.5UT as obtained from the data binned in 30 minutes. This value is derived from magnitude data including the 9-rev trail that is expected to have a smaller r-value. Therefore, r4 must be larger than 2.61. It is supposed that r4 is 2.8 or larger.
Now, how large is r9 here? Since the ZHR profile shows already a large number and a rise in the period between 15h.5 and 17h.0 UT (Figure 1), it is probable that many meteors from the 9-rev trail appeared in that period. While the r-values in that period show a scatter due to the the low elevation of the radiant, they are almost constant with a value of around 2.0 (Figure 3). If meteors from the 4-rev trail already appeared in that period, r9 is smaller than 2.0. However, too small an r-value contradicts the absence of a rise of bright meteors. Therefore, it is supposed that r9 is 1.8-2.0.
In order to calculate ZHR profiles of the individual trails, r4 and r9 must be assumed to be 3.0 and 2.0 respectively, for example, and it must be assumed that the r-values were constant in the observing period.
It is thought that population index r is constant in the visual magnitude range. Then, we can write:
N4,m = N4,0* r4m
where N4,m and N4,0 are the true meteor numbers of the 4-rev trail of magnitude m and 0, respectively.
The temporary N4,0 determines the temporary N4,m and we can derive a temporary N9,m from:
N9,m = ZHRt,m − N4,m
And the temporary r9 is calculated from temporary the N9,m of the magnitude range 0 - +4. If the derived r9 is not the value assumed for r9 at first such as 2.0, for example, N4,0 is changed, and the calculation is repeated to get the r9 value assumed. With such calculations, N4,0 and N9,0 are derived for each period, and we can calculate each magnitude N4,m and N9,m from N4,0, N9,0, r4 and r9. Then the ZHRs of the individual trails can be derived by the correction of perception provability and summing up the numbers of each magnitude class. However, I could not find out how to estimate the errors of the ZHRs of individual trails.
For the 2001 Leonid storm, it was predicted that the Earth should encounter the 10- and 11-rev trails in our observing period and the activity of these trails were lower than that of the 9-rev trail [1,2,3]. Since their r-values are expected to be close to r9, we can hardly distinguish these trails from the 9-rev trail. Therefore, the estimated ZHR of the 9-rev trail includes ZHRs of the 10- and 11-rev trails in this article.
The results are shown in Figure 4. Since we cannot determine r4 and r9 correctly, we must assume their values. I show the case that r4 is 2.8-3.2 and r9 is 1.8-2.0. In the case of r4 = 2.8, the ZHR profile of the 9-rev trail has a dip between 18h and 19h UT. I find that the dip is unusual and the proper value of r4 should be 3.0-3.2. While the estimated ZHR profiles of individual trails vary with the assumed r4 and r9, the ZHR profiles are not so sensitive to changing r4 and r9.
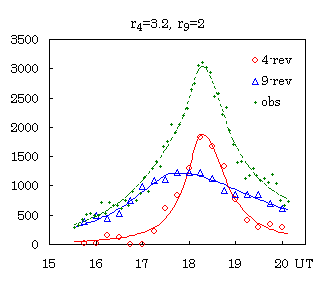
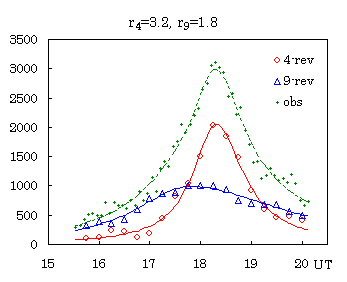
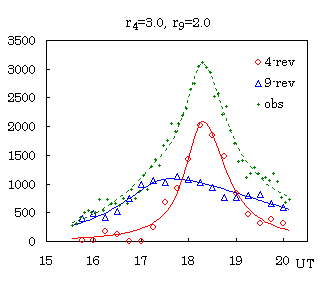
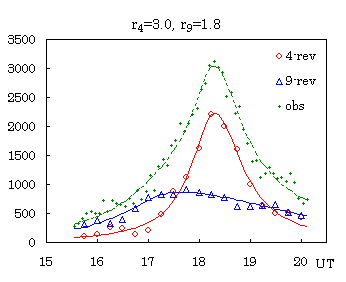
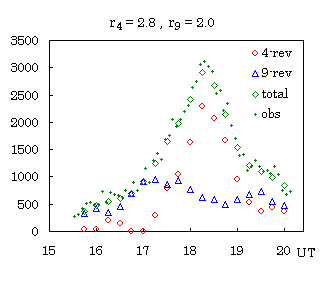
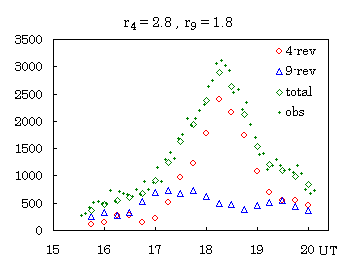
Figure 4 - Estimated ZHR profiles of the 4-rev trail and the 9-rev trail with fitting Lorentz profile lines. Since we cannot determine r4 and r9 correctly, I show the case that r4 is 2.8-3.2 and r9 is 1.8-2.0. In the case of r4 = 2.8, the ZHR profile of the 9-rev trail has a dip between 18h and 19h UT. Since the dip is unusual, I guess that the value of 2.8 is improper for r4, and I did not draw the Lorentz profile in the case. Green dotted lines are for the sum of the values of Lorentz profiles of the 4- and the 9-rev trails. In the case of r4 = 2.8, "total" means the sum of the ZHRs of these trails. The estimated ZHR of the 9-rev trail include ZHRs of the 10- and 11-rev trails, since these trails are difficult to separate from the 9-rev trail.
Jenniskens et al. found that the ZHR profile of the 1999 Leonid storm fits to a Lorentz profile described by the following formula [8]:

Wh is the half width of the profile at half the peak intensity. I drew Lorentz profile lines fitted to the ZHR profiles of individual trails in Figure 4 except the cases of r4 = 2.8. However, the profiles of these trails, especially of the 9-rev trail, are not symmetric, thus the ascending branches from half maximum level are applied to the half width Wh before the peak time, and the descending branches to half maximum level are applied to Wh after the peak time.
By finding the Lorentz profiles being good fits to the ZHR profiles of individual trails with the method of least squares, I estimated the values of peak time, maximum ZHR, full width at half maximum (FWHM), ascending and descending branches from/to half maximum level for the individual trails. I show the results in Table 1 together with the predictions by Lyytinen et al. and McNaught-Asher.
The estimated peak time of the 4-rev trail is consistent with the predictions by these authors. The estimated ZHR profiles of the 9-rev trail show a broad peak, and the peak time is between the predicted times. The estimated FWHM of the 4-rev trail is close to the prediction by Lyytinen et al., while the estimated FWHM of the 9-rev trail is longer than the prediction, the FWHM, especially from the descending blanch, may be affected by 10- and 11-rev trails because the estimated ZHR of the 9-rev trail includes ZHRs of these trails. The maximum ZHRs of these trails are at about half the prediction by Lyytinen et al.
Table 1 - Estimated values and predicted values. The estimated values are derived from Lorentz profiles fitted to estimated ZHR profiles of individual trails in Figure 4 with the method of least squares. However, the profiles of these trails, especially of the 9-rev trail, are not symmetric, thus ascending and descending branches from/to half maximum level are applied to the half width Wh before/after the peak time. Since the 10- and 11-rev trails could not separate from the 9-rev trail in this work, it is thought that the 10- and 11-rev trails affect the values of the 9-rev trail, especially the FWHM and the descending branches.
| Trail | Assumed r-value |
Peak Time UT | Maximum ZHR |
FWHM | Asc. branch | Desc. branch | |
| Estimated result in this work | 4-rev 9-rev |
r4 = 3.2 r9 = 2.0 | 18h 18m 17h 45m |
1880 1220 | 62 m 212 m | 27 m 75 m | 35 m 137 m |
| 4-rev 9-rev | r4 = 3.2 r9 = 1.8 |
18h 18m 17h 46m | 2050 990 | 73 m 216 m | 33 m 78 m | 40 m 138 m | |
| 4-rev 9-rev | r4 = 3.0 r9 = 2.0 |
18h 18m 17h 33m | 2090 1090 | 62 m 231 m | 27 m 71 m | 35 m 160 m | |
| 4-rev 9-rev | r4 = 3.0 r9 = 1.8 |
18h 18m 17h 33m | 2230 870 | 73 m 236 m | 33 m 73 m | 40 m 163 m | |
| Lyytinen et al. [1] | 4-rev 9-rev 10-rev 11-rev | 18h 20m 18h 03m 19h 10m 19h 10m |
5000 2600 150 150 | 86 m 123 m 280+ m 180+ m | 58 m | 65 m | |
| McNaught and Asher [2] | 4-rev 9-rev 10-rev 11-rev | 18h 13m 17h 24m 18h 43m 17h 36m | 8000 2000 40 40 |
Leonid meteors have very large geocentric velocity. Exceptionallly many meteors appeared during the Leonid storm. And I found a fatigue effect for some observers who continued to observe for a long period, as was found in [8]. Therefore, the perception for faint meteors during the Leonid storm might be lower than in [7]. Indeed, the numbers of magnitude +4 meteors are slightly smaller than the values on the regression line (Figure 2). The true population indices, especially r4, may be larger than the value assumed. While value of 3.0-3.2 that I estimated to be proper for r4 are large for major showers, a possibly larger r4 is surprising. If the perception probability for faint meteors was lower and the true r4 is larger, how do ZHR profiles of the 4- and 9-rev trails change? Since I thought that the reduction of the perception probability for faint meteors causes a similar effect such as a reduction of the limiting magnitude, I re-calculated with a tentative correction by reducing limiting magnitude. The result is close enough to the result shown in Figure 4, but a larger value is favored for r4, such as 3.5 for example, and the ZHR values increase by reducing the limiting magnitude.
Here, we can derive ZHRs per magnitude class of individual trails from N4,0 , N9,0 , r4 , r9 , and the perception probabilities. Now, I show the result derived with the assumption of r4 = 3.0 and r9 = 2.0 in Figure 5. Green dotted lines are the sum of the values of Lorentz profiles of the 4- and 9-rev trails.
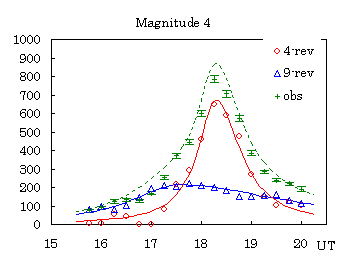
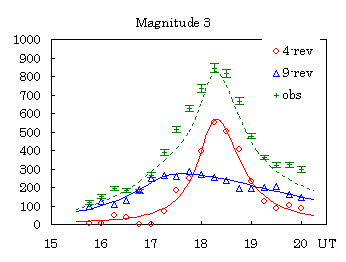
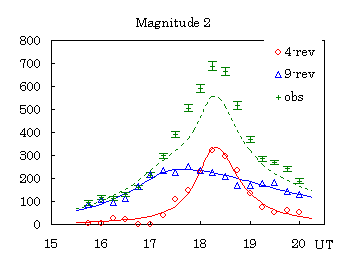
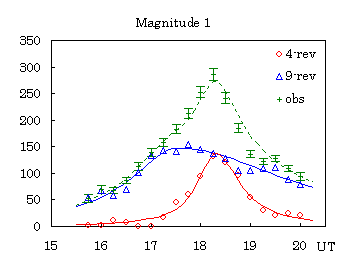
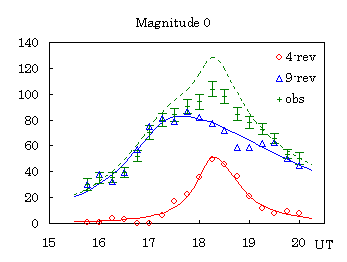
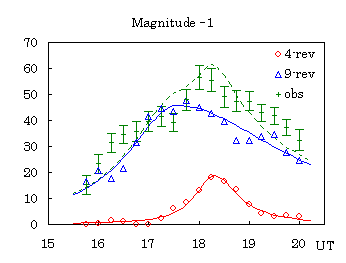
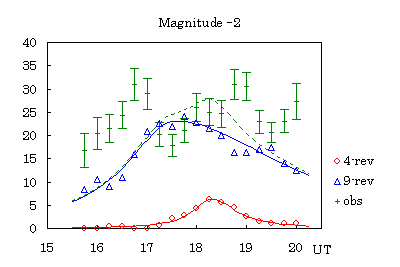
Figure 5 - Estimated ZHR profiles per magnitude class of the 4- and 9-rev trails and the observed ZHR profiles per magnitude class. The results shown here are derived with assumption r4 = 3.0 and r9 = 2.0. Green dotted lines are the sum of the values of Lorentz profiles of the 4- and 9-rev trails.
At magnitude +4, the observed ZHRs are slightly below the estimated line of the sum.
That indicates lower perception for faint meteors during the Leonid storm. At magnitude +2, the observed ZHRs are above the estimated line.
It is possible that the perception for meteors of magnitude +2 is higher than the value in [7], because many Leonid meteors of magnitude +2
produced persistent trains. At magnitude 0, the observed ZHRs are lower than the estimated line, while they are close to the estimated line
at magnitude −1. And at magnitude −2, the estimated line of the sum is not consistent with the observed ZHR profile. While the peak ZHR of
magnitude −2 is close to the peak of that line, the observed ZHR profile shows no rise, although there must be effectively a rise according to
the estimated value. This is an openissue here. It is possible that r4 and
r9 are larger than the value assumed. If r4 and
r9 are larger, we had to observe more faint meteors and less bright meteors.
It is possible that the perception provability for faint meteors was lower than the value in [7] during the Leonid storm. Then, we can explain
that the observed ZHRs of magnitude +3 to +4 are close to the estimated line of the sum, and that the observed ZHRs of magnitude 0 are lower
than the estimated value. Although the observed ZHRs of magnitude −1 are close to the estimated sum line, shape of the ZHR are slightly
different. If r4 and r9 are larger, meteors of magnitude −1
and −2 from the 4- and 9-rev trails are less than the estimated line. But it is thought that there was a source of bright meteors (section 3).
Strictly speaking, the population indices of the 10- and 11-rev trails are expected to be slightly smaller than that of the 9-rev trail [3]. It is possible that the 10- and 11-rev trails have small population indices and that they were the source of bright meteors, though it is uncertain. It is expected to be studied in future work.
Some readers may think that one can assume a proper r-value for the 10- and 11-rev trails and calculate the ZHRs of the individual trails separating them from the 9-rev trail. However, this method has a problem. When there are two trails to be considered, assuming r4 and r9 determine only one solution with a set of N4,0 and N9,0 . But, when we want to calculate ZHRs of three or more trails, there are many solution with sets of N4,0 , N9,0 , N10,0 and N11,0 , and one cannot determine a unique solution.
Figure 5 shows that the 4-rev trail supplied many faint meteors, and most of the meteors of magnitude −1 were by the 9-rev trail. If r4 and r9 were larger and there was a source of bright meteors, the numbers of bright meteors from the trails were smaller than the estimated values. While, it is predicted that storm level activity will be caused by the 4-rev trail in 2002 again [2,3], it is possible that an abundance of faint meteors and a few bright meteors will appear in the sky with a full Moon.
この論文は、International Meteor Organization (IMO 国際流星機構)の機関紙 WGN に投稿し、2002年6月(WGN 30:3)に掲載されたものです。