
WGN, THE JOURNAL OF THE IMO 38:1, 2010, pp. 31-35
Shigeo Uchiyama
The activity profiles of ZHRs per magnitude class of the Geminids were derived from the Visual Meteor Database (VMDB) of the IMO. The maximum solar longitude, Lmax, depends on the magnitude class m, according to the equation Lmax = 262.°328(±0.°033) - 0.°055(±0.°014)m (eq. J2000.0). The profile widths of the brighter classes are narrower. The relationship between the FWHM and magnitudes class is FWHM = 1.°347 (±0.°046) + 0.°119(±0.°018)m. Then the profile of the population index was obtained from these equations.
The Poynting-Robertson effect (hereafter P-R effect) causes the orbital speeds and semi-major axes of the dust grains to decrease with time (Wyatt & Whipple, 1950). Since smaller dust grains are more affected by the P-R effect than larger grains, many small dust grains will be perturbed onto orbits interior to the shower while large grains remain outside. The P-R effect strongly affects dust grains which have a small perihelion distance q and small revolution period P. Since the orbit of the Geminids has a small perihelion distance (q ~ 0.14 AU) and short period (P ~ 1.6 yr), the P-R effect has significantly influenced the Geminids. The Earth approaches the Geminids from the inside boundary of the shower orbit and continues through to the outside. Thus the population index of the Geminids varies from large to small at near maximum activity (Rendtel, 2004). This paper presents the calculated ZHRs per magnitude class, ZHRm, of the Geminids from the IMO's Visual Meteor Database (VMDB), and as well as the dependences of the maximum solar longitude and activity width on the meteor magnitude.
ZHRs per magnitude class, ZHRm, are calculated for each magnitude class by IMO standard formula
except for the limiting magnitude correction.

 |
Figure 1 - Perception coefficients as a function
of the difference between meteor magnitude and mean limiting magnitude.
|

The VMDB on the IMO Web page contains a large number of visual meteor observation data with rates and magnitude distributions. Magnitude data were used to derive ZHRm. The magnitude data in the VMDB does not contain the effective observation time Teff and the field obstruction factor F, although they are needed to calculate the ZHRm. Rate data were compared with the magnitude data, and added the Teff and the F to the magnitude data. I selected the data to derive ZHRm of the Geminids with following criteria; 1) Moon light pollution was small, i.e., 1993, 1996, 1998, 1999, 2001, 2002, 2004, 2007; 2) the limiting magnitude was fainter than 5.0; 3) the field obstruction factor F was less than 1.4; 4) the radiant height was over 25 degrees; and 5) the observation period, from the begin to end, was less than 2 hours. The total number of Geminid meteors analyzed were 72421 in 1244.2 hours of total effective observation time.
Each observer has a personal coefficient. When analysis is done without personal coefficients, the result may be skewed due to different perceptions of each observer. Therefore, we need to obtain perception coefficients for the observers. Standard meteor numbers are needed to derive personal coefficients. Although sporadic meteor numbers are used as the standard meteor numbers in many cases, sporadic meteor numbers are small and have poorer statistics. The Geminid ZHR profile was used as standard meteor numbers to calculate personal coefficients in this work. Thus the Geminid ZHR profile was derived first. The calculation formula to obtain ZHRs is the IMO standard procedure with assumed population index r = 2.0. Figure 2 shows the profile.
 | |
| Figure 2 - ZHR profile of the Geminids.
The ZHRs were calculated with assumed population index r = 2.0,
and were used as standard numbers to derive personal coefficients. | |
Jenniskens et al. (2000) showed that a Lorentz profile fits 1999 Leonids storm profile.
The formula of a Lorentz profile is:

Since a Lorentz profile is symmetric and the Geminid profile is asymmetric,
the half-width W/2 was translated into two values,
Wa for ascending branches and Wd for descending branches.
The Lorentz profile fitted to the Geminid profile was obtained by a weighted least square method,
and is also shown in Figure 2. The weighting was proportional to the inverse error.
Using the Lorentz profile as the standard number at the solar longitude,
the personal coefficients were calculated as corrections of the limiting magnitude dLm for all observers
(r = 2.0 was assumed).
For observers who recorded many observations, the personal coefficients of all observations were averaged.
Observations by observers whose absolute personal coefficients |dLm| are greater than magnitude 1.0 were omitted.
Although one may think that the data should be analyzed in each year, all eight years of data were analyzed together. The reasons are that; 1) a large amount of data are needed to calculate ZHRs per magnitude class since observed meteor numbers are divided into each magnitude class; and 2) observation gaps exist in any one years data due to longitude distribution of observation sites and weather conditions. I have analyzed some meteor showers from Japanese observations since 2002, and the Geminid activities have shown small scatter from year to year in comparison with the Perseids or the Quadrantids. Therefore, the analysis from all years data is acceptable. The solar longitude bin size adopted was 0.05 degree (around 1.25 hours). Since bright meteor numbers are small and statistically insufficient in 0.05 degree steps, a bin size of 0.1 degree was adopted for magnitude -1 or brighter. When a bin of data was insufficient, nearby data was added to have sufficient data.
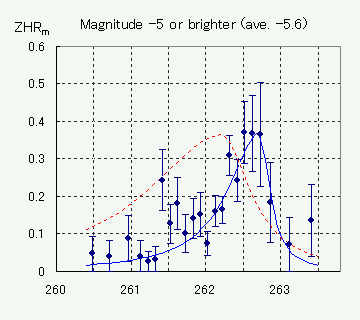
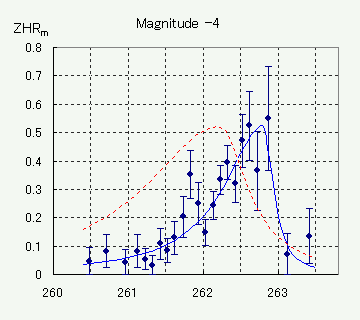
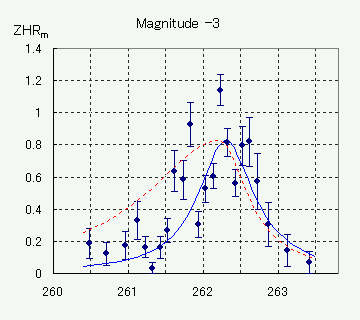
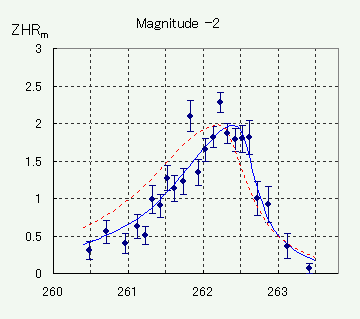
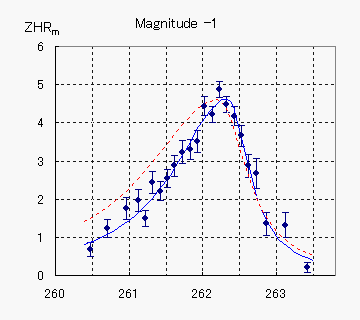
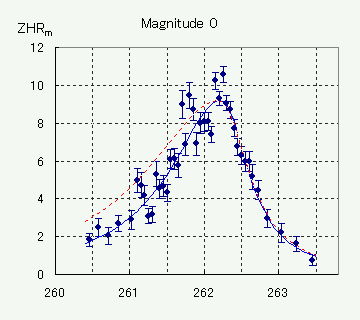
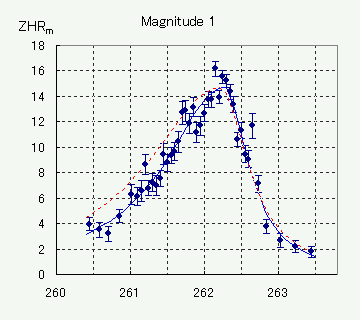
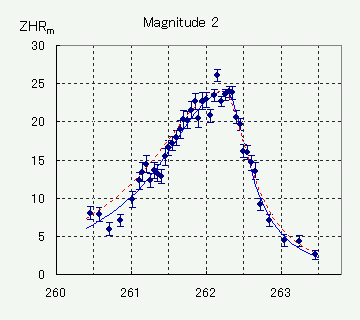
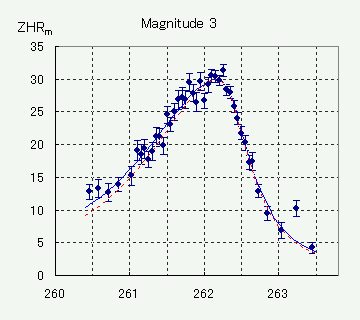
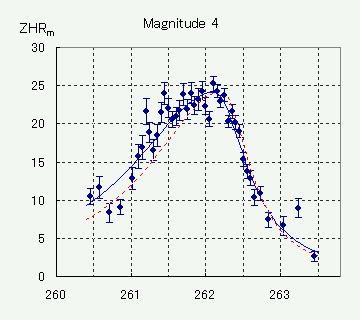
The calculated ZHRm are shown in Figure 3. The Lorentz profiles for the ZHRm were derived by a least square method, and are also shown for the profiles in Figure 3.
 |
 | |
 |
 | |
 |
 | |
 |
 | |
 |
 | |
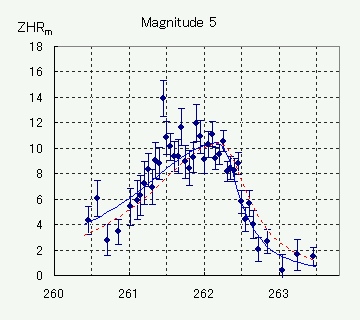 |
Figure 3 ZHRs per magnitude class ZHRm of the Geminids.
The solid lines show fitted Lorentz profiles.
The dotted lines show ZHR shapes with conversion ZHR maximum to the ZHRm maximum
for comparison with shapes of ZHRm.
The horizontal axes are solar longitude (J2000.0). |
Generally the descending branches are steeper than the ascending branches. The descending branches are very steep for very bright meteors. The total ZHR maximum corresponds to the maximums of magnitude 2 or 3 meteors. The maximums of very bright meteors show delays of about half a day from the total ZHR maximum. When the ZHR maximum occurs in daytime, you can see about one fireball per hour the following night. When the ZHR maximum occurs during the nighttime you can see few fireballs the next night. ZHRm of magnitude 4 and 5 show similar activity levels from solar longitude 261.°5 to 262.°2.
By fitting Lorentz profiles, it is possible to obtain the maximum solar longitude Lmax, ascending branch Wa, descending branch Wd, full-width at half-maximum FWHM, and the maximum ZHRm, ZHRm,max, for any magnitude. The relation between the meteor magnitude class m and the maximum solar longitudes is shown in Figure 4, and the relations between the meteor magnitude class and the ascending branches Wa, descending branches Wd, full-width at half maximum FWHM are shown in Figure 5.
 |
 |
| Figure 4 Maximum solar longitude Lmax versus meteor magnitude. |
Figure 5 Width versus meteor magnitude. FWHM are Full Width at Half Maximum,
Wa and Wd are half width of ascending branches and
descending branches respectively. |
The figures show that the brighter meteors have later maximum solar longitudes and narrower activity widths.
The derived relations between them, assuming a linear relationship, are as followed;
| Lmax = 262.°328(±0.°033) - 0.°055(±0.°014)m | (1) | |
| Wa = 0.°956(±0.°045) + 0.°088(±0.°016)m | (2) | |
| Wd = 0.°390(±0.°030) + 0.°029(±0.°013)m | (3) | |
| FWHM = 1.°347(±0.°046) + 0.°119(±0.°018)m | (4) |
 |
| Figure 6 True meteor number ZHR per magnitude class at maximum ZHRt,m,max
versus meteor magnitude. They fit a regression line well. |
With perception coefficients and ZHRm,max,
the true meteor number ZHRmax of magnitude classes ZHRt,m,max were calculated.
They fit a regression line well (Figure 6). The derived relation between m and ZHRt,m,max is
| ZHRt,m,max = 8.96(±0.40) × 2.084(±0.045)m | (5) |
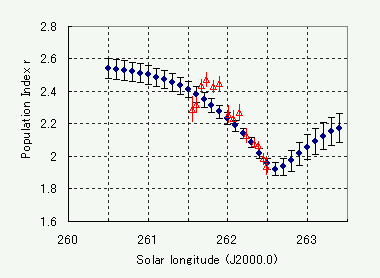 |
| Figure 7 Profile of the population index of the Geminids. The profile was obtained using equations (1) to (5) (navy filled circles). Red open triangles show population index by Rendtel (2004). He derived the profile from moonless returns of the Geminids between 1988 and 1997. |
Using equations (1) to (5), ZHRt,m at any solar longitude can be calculated. Then the population indices were obtained by regression method. The profile is shown in Figure 7 (nevy filled circles). The minimum of the population index is 1.92 ±0.04 at solar longitude 262.°6. This coincides with the maximum of magnitude -5. Since bright meteor activities fall steeply after their maximum, the population index goes up again after the minimum. The population index profile in Rendtel (2004) is also shown in Figure 7 (red open triangles). He derived the profile from moonless returns of the Geminids between 1988 and 1997. The profile corresponds to the one in this work well.
If the P-R effect had no affect on the Geminids, all magnitude meteors would have same maximum time. In that case, the population index at the ZHR maximum would be 2.08 ±0.05 from equation (5). Since brighter meteors show shorter width, the total numbers of meteoroids per magnitude classes of the shower are not proportional to the ZHRt,m,max, but are proportional to the FWHM times the ZHRt,m,max. The averaged population index of the Geminids during the whole activity period can be calculated as 2.28.
Several studies concerning the maximum times and the activity widths as a function of dust grain sizes of the Geminids have been conducted by radar and visual observations (Table 1 and 2). They showed that larger meteoroids have later maximum times even though the published times show some scatter.
| method | L0 | A | B | |
| McIntosh & Simek (1980) | radar | 262.°0 | -0.°135 | |
| Simek et al.(1982) | radar | 261.°99 | -0.°118 | |
| Simek & McIntosh (1989) | radar | 262.°04 | -0.°11 | |
| Pecina & Simek (1999) | radar | 262.°15 ±0.°07 | -0.°15 ±0.°07 | -0.°04 ±0.°02 |
| Spalding (1984) | visual | 262.°25 ±0.°05 | -0.°078 ±0.°025 | |
| This work | visual | 262.°328 ±0.°033 | -0.°055 ±0.°014 |
| method | W0 | C | |
| Simek & McIntosh (1989) | radar | 1.°36 | +0.°42 |
| This work | visual | 1.°347 ±0.°046 | 0.°119 ±0.°018 |
In comparison with these radar observations, the visual observations show that the L0 (maximum solar longitude of magnitude 0) are late and the A (change rates with magnitude) are small. Although the W0 (FWHM of magnitude 0) of radar observations correspond to that of visual, the C (change rate with magnitude) of radar observations is large. These radar data used radio magnitude Mr. These results indicate that the radio magnitude do not correspond to visual magnitude well.
ZHRs per magnitude class ZHRm of the Geminids were derived from
VMDB available at the IMO website.
The profiles show that brighter meteors have later maximum and narrower width. The relations are
| Lmax = 262.°328(±0.°033) - 0.°055(±0.°014)m |
| FWHM = 1.°347(±0.°046) + 0.°119(±0.°018)m |
この論文は、International Meteor Organization (IMO 国際流星機構)の機関紙 WGN に投稿し、 2010年12月(WGN 38:1)に掲載されたものです。